Design and Concepts
This section describes the internal design of Cyanite and the different components which it builds upon.
Internal Architecture
Cyanite’s internal architecture is that of the typical stream processing project, it connect inputs to outputs while doing normalization and mangling.
The internal architecture can be represented with this simple diagram:
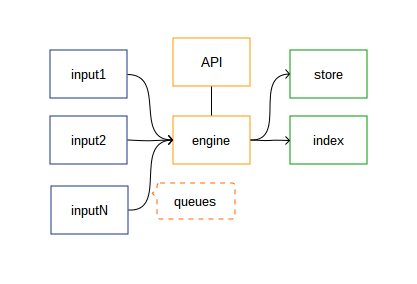
As is described on the diagram the workflow is:
- Each input produces new normalized payloads (metrics), and enqueues them.
- The engine core pops items off the queue and processes them
- When applicable items are handed off to a store and index. components respectively responsible for persisting time-series and indexing metric names.
- An API component which is able to interact with the engine and other components to query and present data.
Input Components
Input components are arbitrary means of inputting metrics.
Out of the box there are three available types of input
components, such as carbon: a TCP listener for the text
protocol known as Carbon, which is part of the Graphite
tool-suite.
The other inputs, such as Kafka, Pickle are planned but not yet supported by Cyanite.
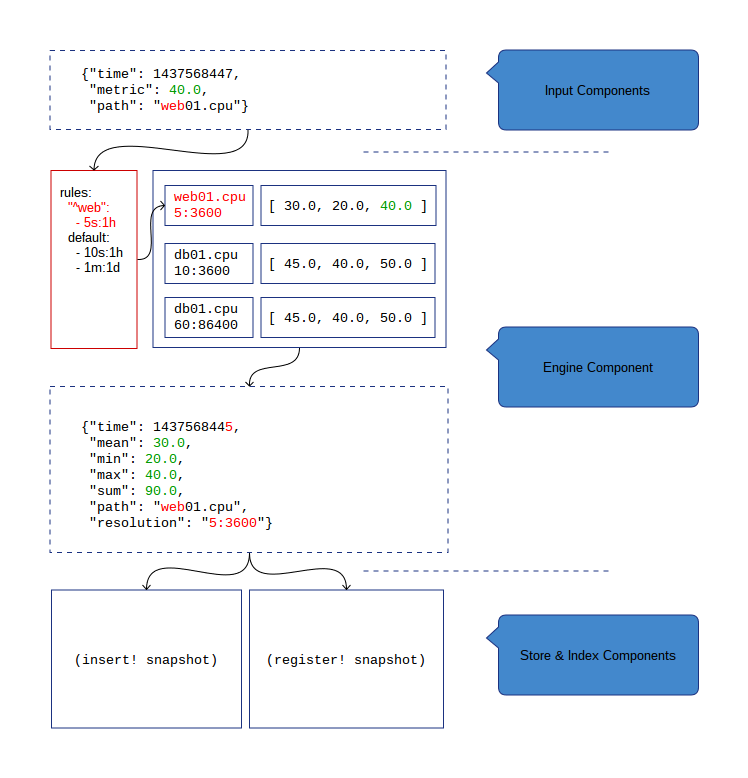
Input components are responsible for producing metrics in a normalized way:
{
  "path":   "web01.cpu",
  "metric": 40.0,
  "time":
}
Once a metric has been normalized, it is handed over to the engine
component through its accept! function:
(accept! engine {:path "web01.cpu" :metric 40.0 :time })
Engine Component
The engine component is responsible for popping metrics off of its input queue, aggregating data over a time-window and producing write operations on the index and store components when necessary.
To do this it holds on available points for a while and flushing them out when necessary.
Note
The fact that Cyanite holds on to metrics in memory makes it a stateful server. As such if you wish to use Cyanite in a redundant fashion, you will need to account for it. See the Administrator Guide for details on how to deal with this.
Aggregation Mechanism
The aggregation mechanism for metrics relies on a fast in-memory hash-table. Each metric is kept on a bucket corresponding to the metric path and its resolution. When a time-window has passed for a metric sums, means, minimas and maximas are computed and emitted as a /snapshot/.
Cyanite supports several resolutions based on a first-match set of rules
as provided in the configuration file. Rules are a list of patterns
to match a metric name on corresponding to a list of resolutions
(in the form <precision>:<period>).
Snapshots are then handed over to the store and index components. The process can be represented visually like this:
Note
Cyanite accounts for drift by comparing its wall clock to the values provided in metrics. Once a resolution’s time-slot passes over including when accounting for drift, values are flushed and a snapshot is created. This means that out-of-order values may be supplied but not once a time-slot has already been flushed.
Store component
The store component is called for each snapshot created by the engine component. The only working component stores data to Apache Cassandra.
Storage Schema
The following schema is used to store data:
CREATE KEYSPACE metric
                WITH replication = {'class': 'SimpleStrategy',
                                    'replication_factor': '1'}
                AND durable_writes = true;

USE metric;

CREATE TYPE metric_point (
  max double,
  mean double,
  min double,
  sum double
);

CREATE TYPE metric_resolution (
  precision int,
  period int
);

CREATE TYPE metric_id (
  path text,
  resolution frozen<metric_resolution>
);

CREATE TABLE metric.metric (
  id frozen<metric_id>,
  time bigint,
  point frozen<metric_point>,
  PRIMARY KEY (id, time)
) WITH COMPACT STORAGE
  AND CLUSTERING ORDER BY (time ASC)
  AND compaction = {'class': 'DateTieredCompactionStrategy', 'min_threshold': '12', 'max_threshold': '32', 'max_sstable_age_days': '0.083', 'base_time_seconds': '50' }
  AND compression = {'sstable_compression': 'org.apache.cassandra.io.compress.LZ4Compressor'}
  AND dclocal_read_repair_chance = 0.1
  AND default_time_to_live = 0
  AND gc_grace_seconds = 864000
  AND max_index_interval = 2048
  AND memtable_flush_period_in_ms = 0
  AND min_index_interval = 128
  AND read_repair_chance = 0.0
  AND speculative_retry = '99.0PERCENTILE';
This schema leverages Cassandra’s Compact Storage option to ensure a minimal overhead.
Please be sure to choose the optimal compaction strategy for your use case. If available
the DateTieredCompactionStrategy is likely your best bet.
Index Component
The index component is responsible for building an index of path names and providing a way of querying them back. There are two implementations of this component available:
memorystores an in-memory inverted index.elasticsearchstores path-names in elasticsearch.
Note
The memory index is a poor choice for redundant setups since it will only know of
metrics passing through it. Additionally, it is only valid to use it when metric name
cardinality is limited and metrics are recurrent since it will lose all its index upon
restarts.
API Component
The API component is responsible for exposing an HTTP service to service queries. The API component exposes the following HTTP routes:
/ping: report online status/metrics: query metrics. Takesfrom,to(optional), and any number ofpatharguments./paths: query paths. Takes aqueryargument.
Any other request will yield a 404 response.